Before fireworks streaked across the skies of southern California on July 4, nature unleashed its own thunderous blast of energy: an earthquake.
The magnitude 6.4 temblor struck near Ridgecrest around 10:34 a.m. PT, cracking roads, bursting water mains, and toppling electrical power lines with its might.
A larger, 7.1 magnitude has since struck Southern California. Before that, the 6.4 quake was the most powerful to rattle the state in 20 years, and its shaking ended a five-year "drought" of earthquakes for California. Luckily, no deaths or major injuries have yet been reported.
As with all earthquakes, the Ridgecrest event was felt far beyond the borders of California – though not by people. Rather, incredibly sensitive devices called seismometers picked up the quake's rumbles from thousands of miles away.
Seismometers record the various ground motions of earthquakes, and a single station's data isn't all that interesting. Yet when many of the devices are sprinkled across a continent, they can be used to reconstruct a seismological event as it spreads, dissipates, and even bounces off underground structures.
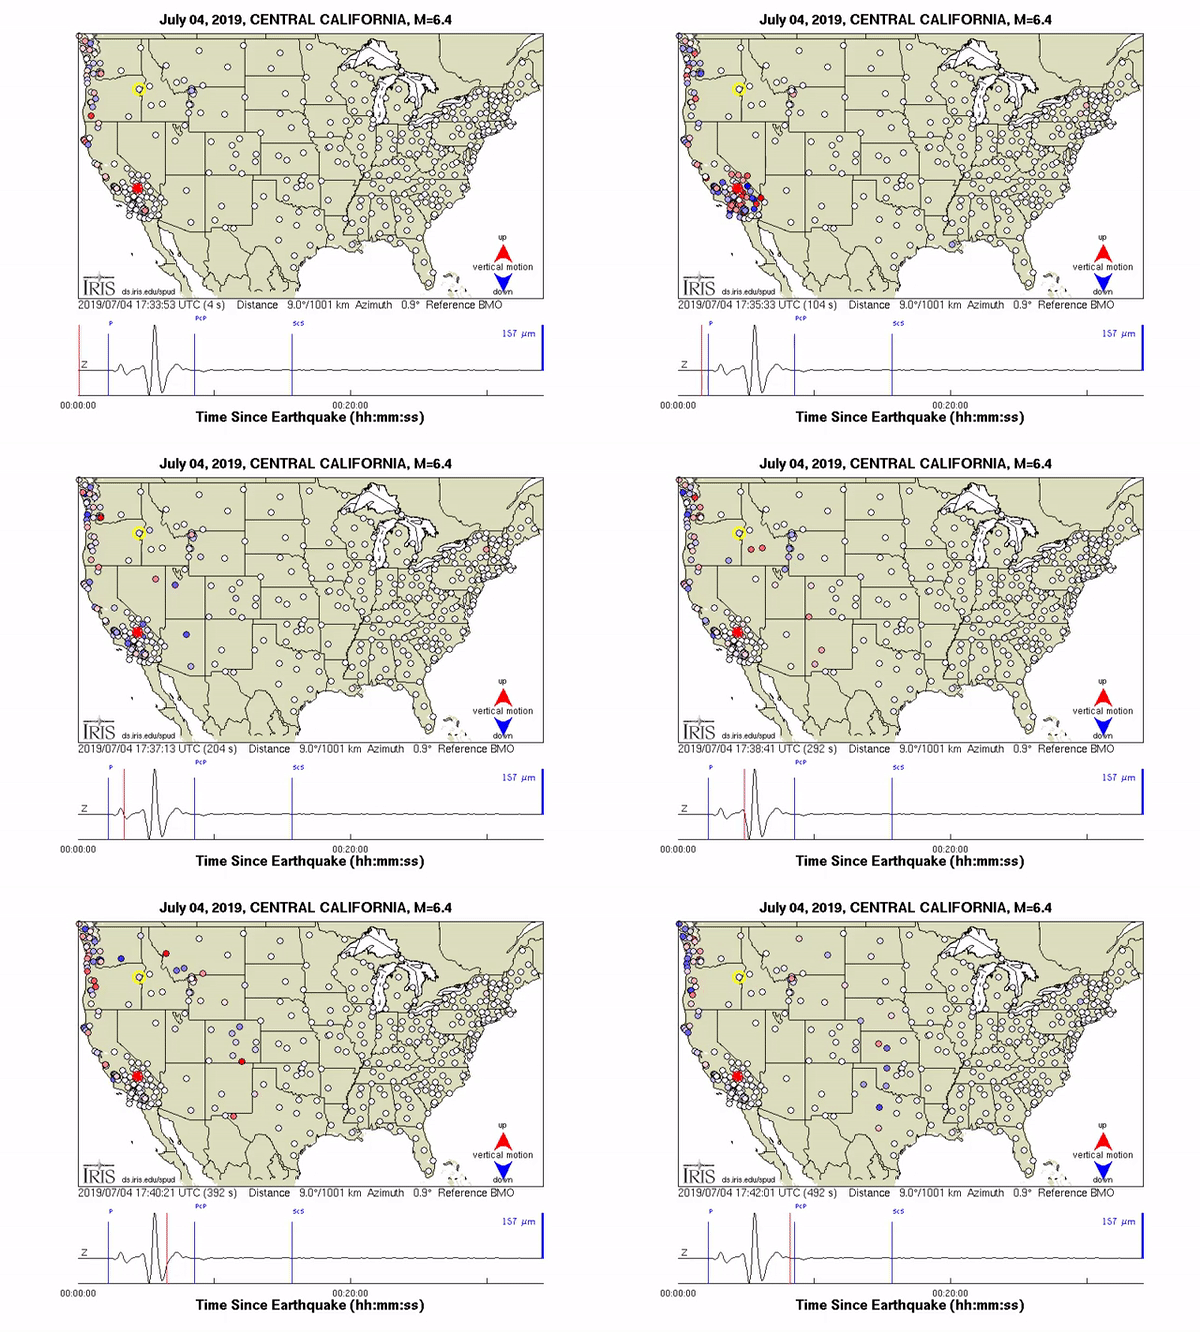
As shown by a network of hundreds of seismometers called USArray, which is funded by the National Science Foundation, that seismic-wave data can look incredible.
"The ground motions can be captured and displayed as a movie, providing a visual demonstration of these often indiscernible movements," IRIS, a research group that studies seismological events and logs USArray data, says on its website. "The visualisations illustrate how seismic waves travel away from an earthquake."
A Twitter account managed by IRIS posted one such video of California's earthquake on Thursday night.
"Watch the waves from the M6.4 southern California earthquake roll across the USArray seismic network," the group said in a tweet sharing the video below.
Watch the waves from the M6.4 southern California #earthquake roll across the USArray seismic network (https://t.co/RIcNz4bgWq)! #socalearthquake THREAD pic.twitter.com/RUcTkh4cHF
— IRIS Earthquake Sci (@IRIS_EPO) July 5, 2019
On its website, IRIS also shared a US-focused clip of the July 4th quake:
 (IRIS)
Each animation of the earthquake by IRIS compresses about 34 minutes into roughly 20 seconds.
"This animation, called a Ground Motion Visualisation (GMV), shows the motion of the ground as detected on USArray seismometers," IRIS said. "Each dot is a seismic station and when the ground moves up it turns red and when it moves down it turns blue."
White shows a relatively inactive station, and the more intense the red or blue colour, the stronger the relative motion. However, the colours are accentuated far away from Ridgecrest to show ground movements on the scale of the width of a human hair.
"Once the earthquake waves are far enough away from the location where the earthquake occurred they can no longer be felt by people, but they can still be detected by sensitive seismic instruments," IRIS added.
"That's what this animation is showing – the waves from the California earthquake travelling through the Earth and across Earth's surface."
The shaking was felt from Mexico to San Francisco to Las Vegas, IRIS noted, "but was measured across the world."
This article was originally published by Business Insider.
More from Business Insider:
https://www.sciencealert.com/epic-videos-show-the-july-4-earthquake-rippling-across-north-america
2019-07-06 10:20:17Z
CBMiYWh0dHBzOi8vd3d3LnNjaWVuY2VhbGVydC5jb20vZXBpYy12aWRlb3Mtc2hvdy10aGUtanVseS00LWVhcnRocXVha2UtcmlwcGxpbmctYWNyb3NzLW5vcnRoLWFtZXJpY2HSAWVodHRwczovL3d3dy5zY2llbmNlYWxlcnQuY29tL2VwaWMtdmlkZW9zLXNob3ctdGhlLWp1bHktNC1lYXJ0aHF1YWtlLXJpcHBsaW5nLWFjcm9zcy1ub3J0aC1hbWVyaWNhL2FtcA
Bagikan Berita Ini


0 Response to "Videos Show The July 4 Earthquake Rippling Across North America - ScienceAlert"
Post a Comment